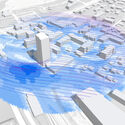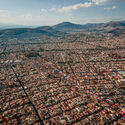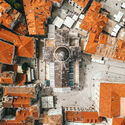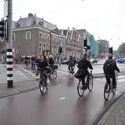
City Science, a rapidly expanding profession, is the scientific study and engineering of urban systems. It uses advanced technologies, big data, and complex systems physics to tackle challenges such as decarbonization, mobility, and livability. At its core, city science is about data-driven solutions. It employs statistics, modeling, and artificial intelligence to reveal the hidden dynamics of cities, from energy use to human movement. It employs strategies that reduce carbon emissions, enhance efficiency, and foster urban environments that are more sustainable and resilient.
City science views the city as a living system, expanding traditional models of building and street compositions. It builds unified performance models that measure the social, economic, and environmental impact of interventions. It integrates transport planning with land use, analyzes networks of connections, and tests policies through simulation. It operates at the community scale, creating hyperlocal tools that enable neighborhoods and local governments to make informed decisions. The aim is not abstract theory but practical strategies that improve everyday life.
This approach is already shaping cities worldwide. The City Science group at MIT Media Lab is developing new ways to model urban performance and climate resilience. City Science Labs in Bologna and Andorra are applying complex systems physics and data analytics to guide sustainable transitions. Smaller firms are creating tools and strategies for decarbonization and urban efficiency. Together, these examples demonstrate a discipline that is growing rapidly, one that architects and students should engage with. For designers, city science is a partner that can expand creativity, ground design in evidence, and shape the future of how we build and live.
Related Article
The Barcelona Method: How Climate Data is Saving Historic Architecture from Carbon StrandingRemote Sensing: Satellites as Design Tools

Remote sensing, a vital tool in urban science, transforms streams of images and signals into a comprehensive portrait of the urban landscape. Satellites, drones, and aerial systems collect data at a scale that is both global and intimate, providing architects with spatially detailed and frequently updated information. This practical tool enables the tracking of growth, measurement of environmental factors, and assessment of risks, empowering architects to make informed design decisions.
One of its core contributions is monitoring land use and land cover. Remote sensing reveals how open land is being consumed, how neighborhoods densify, and how these shifts alter the city's structure. This goes beyond mapping. It is about reading the morphology of urban form and the patterns that emerge over time. For designers, it provides a sharper awareness of context, enabling them to understand not only the site but also the broader dynamics that influence it. For instance, it can aid in site selection for a new project, understanding the project's impact on the surrounding area, and even in designing structures that are resilient to environmental changes.

Remote sensing also captures what cannot be seen from the ground. It can measure surface temperatures across an entire metropolitan area, making the urban heat island effect visible. It can monitor air quality, detect particulate matter, and even identify waterlogging during rainy seasons. It can quantify the balance between built surfaces and green spaces, providing architects with clear evidence for sustainable strategies. In this way, remote sensing links to the health of the environment.
Its importance becomes even more visible in moments of crisis. After floods, earthquakes, or hurricanes, satellites provide real-time assessments of damage. This capability shapes disaster response, but it also shows how design and planning can prepare cities for future risks. By engaging with this data, architects can create projects that are not only functional but adaptive.

The power of remote sensing grows exponentially when combined with Geographic Information Systems (GIS) and artificial intelligence. GIS integrates spatial data with social and economic information, producing layered models of urban systems. AI can process massive datasets automatically, detect patterns, and even model future scenarios, such as the impact of climate change on growth. Together, these technologies transform remote sensing into a forward-looking tool, enabling architects to design with a keen eye on the future.
For architects and students, the lesson is clear. Remote sensing offers reliable and current knowledge that can ground design in evidence. It invites them to look beyond the boundary of a project and understand how their work interacts with the larger systems of the city. The future of this field lies in automation and data fusion, which enables the extraction of insights from multiple sources into a cohesive, unified picture. To embrace remote sensing is to accept a new vantage point, one that expands the imagination of what design can achieve.
Network Analysis: Finding Hidden Logics in Streets and Systems

Cities are webs of connections. Roads, transit lines, utilities, and digital networks tie people and places together. Beneath the surface, social networks and flows of information link communities in invisible ways. Network analysis is the science of making sense of these webs. It applies graph theory and complex systems thinking to measure how cities function as interconnected networks.
The process starts with data. Street networks can be drawn from open sources and modeled as graphs where intersections are nodes and streets are edges. Human mobility data from GPS, sensors, or even social media can reveal how people actually move through the city. Social interactions can be mapped to illustrate how communities connect and how decisions are disseminated throughout them. These datasets create a framework that allows the city to be studied as both a physical and a social organism.

Once modeled, the networks can be explored with specialized tools. GIS software, such as QGIS, helps visualize and filter network data. Programs such as OSMNX, NetworkX, and Gephi transform raw information into graph-theoretic models, generating insights into connectivity, accessibility, and flow. Advanced algorithms can analyze mobility, detect clusters of activity, or track the evolution of systems over time. Through this analysis, the city's hidden structure comes into focus.
Key indicators guide the interpretation. Connectivity measures how well the network holds together. Centrality highlights the critical nodes that carry disproportionate weight in mobility or access. Accessibility calculates how easily people can reach destinations, often expressed in travel-time maps. Flow quantifies the movement of people, goods, and information. Each metric reveals a distinct dimension of urban life, and together they form a more comprehensive picture of urban life.
For architects, the implications are profound. Network analysis can inform the design of infrastructure, making it more efficient and equitable. It can connect land use planning with mobility patterns, explaining why some areas flourish while others stagnate. It can link urban vitality to street connectivity, showing how design influences social and economic energy. It also supports sustainability by guiding mobility strategies that reduce environmental impact. By understanding and leveraging the insights from network analysis, architects can create more livable, efficient, and sustainable urban environments.

The scope of network analysis extends beyond the physical. By mapping social networks, planners can design participatory processes that improve collaboration and inclusion. At larger scales, analyzing inter-city networks can reveal regional hierarchies and guide economic development. For designers, this means thinking of cities not just as built forms but as living networks of relationships and flows.
The promise of network analysis lies in its ability to uncover hidden logics. It demonstrates why certain streets pulse with life while others remain empty. It explains why some systems collapse under stress while others adapt. For architects and students, adopting this perspective means designing with awareness of how the built environment shapes and is shaped by connection. It transforms design into a dialogue with the networks that sustain urban life.
Transportation Modeling: Simulating Movement

If network analysis shows the structure of cities, transportation modeling reveals how they move. At its core, transportation modeling is a digital representation of how people and goods travel within an urban area. It utilizes specialized software and large datasets to simulate traffic flows, forecast demand, and assess the impact of various policies or infrastructure changes on mobility. For architects and planners, it is a predictive tool that connects design with real-world experience.
The foundation of transportation modeling is the "four-step model." It begins with trip generation (how many journeys originate), continues with trip distribution (where those journeys go), then looks at mode choice (how people travel, whether by car, bus, bike, or foot), and ends with route assignment (which paths they take). This sequence builds a picture of urban movement, and it can be adapted to evaluate the impact of new housing, transit projects, or road expansions.

What makes transportation modeling especially valuable is its integration with land use. It does not just measure traffic; it shows how development patterns, employment centers, and population distribution influence mobility. By running scenario analyses, city scientists can test options before they happen: What if a bypass is built? What if a transit line is extended? What if a neighborhood is redesigned to favor walking and cycling? The answers reveal not just how travel times shift, but how congestion, emissions, and urban form respond.
The implications for design are significant. Transportation modeling can enhance mobility by reducing congestion and improving accessibility. It can promote sustainability by quantifying environmental impacts, particularly CO2 emissions, and by supporting plans for active mobility and greener streets. It can guide infrastructure investments by showing where resources will have the most significant impact. And ultimately, it can make cities more livable by centering movement around people rather than cars.

For architects and students, transportation modeling provides a means to integrate design with mobility, land use, and sustainability. It serves as a reminder that every project exists within a broader system of flows, and that the success of a space often depends on how easily people can access it. By working with city scientists who model transportation, designers gain insights that help them create not just buildings, but better cities.
From Crowdsource Data to Simulation Models: Additional Approaches to City Science

Remote sensing and network analysis may be the foundations of city science, but the field is far broader. City scientists rely on a growing set of tools to make urban systems visible and to test how they behave under pressure. Each tool highlights a different dimension of city life, and together they create a more complete picture of the urban condition.
Density maps reveal how people and buildings concentrate across the city, offering snapshots of growth, land use, and environmental impact. Agent-based models and simulations allow city scientists to test scenarios, such as how pedestrians might flow through a new public space or how traffic patterns might shift with a redesigned transit line. Sensor networks enable real-time monitoring of air quality, energy usage, and traffic, transforming the city itself into a living laboratory.

Other methods add even more layers. Crowdsourced data from mobile devices and social media can capture human activity patterns that traditional surveys miss. 3D visualization tools transform complex datasets into forms that architects and planners can directly read and apply. Big data analytics combines these sources into interactive dashboards that enable decision-makers to view the city's evolution in real-time.
For architects and students, the value is not in mastering every algorithm or platform. It lies in understanding that these tools exist, and in learning how to collaborate with those who use them. City scientists can provide evidence that strengthens design choices, tests assumptions, and advances sustainability goals. Working with these methods ensures that projects are not only creative but also tuned to the hidden dynamics of urban life.
The City Scientist as Creative Design Partner

City science demonstrates that data and design are not separate languages but complementary ways of seeing the world. Where architects imagine form and experience, city scientists reveal the underlying systems that make those visions possible. Together, they can bridge the gap between aspiration and evidence, shaping the decisions that make cities imaginative and functional. This partnership is not about diluting creativity with analysis. It is about expanding creativity by grounding it in knowledge of how cities actually work.
The stakes are high. Cities face the urgent demands of decarbonization, climate adaptation, and equitable growth. Intuition alone cannot meet these challenges. Design decisions must be tested against the realities of energy flows, mobility networks, and environmental pressures. City science equips architects with the tools to engage directly with these realities. It allows designers to model futures before they are built, to evaluate trade-offs, and to create solutions that are sustainable in the long term. For students, this is an invitation to expand their skill set and enter the profession prepared for the complexities of the twenty-first century.

The future requires designing with data. When embraced, city science transforms our understanding of the possibilities in urban life. To create the cities of tomorrow is to step into this partnership, bringing creativity and science together to build places where humanity and sustainability thrive side by side.


